
Workforce Intelligence for Utilities and Field Service Operations: What to Measure Before You Automate
Published · Wendy Kinney
Last updated
Published · Wendy Kinney
Last updated
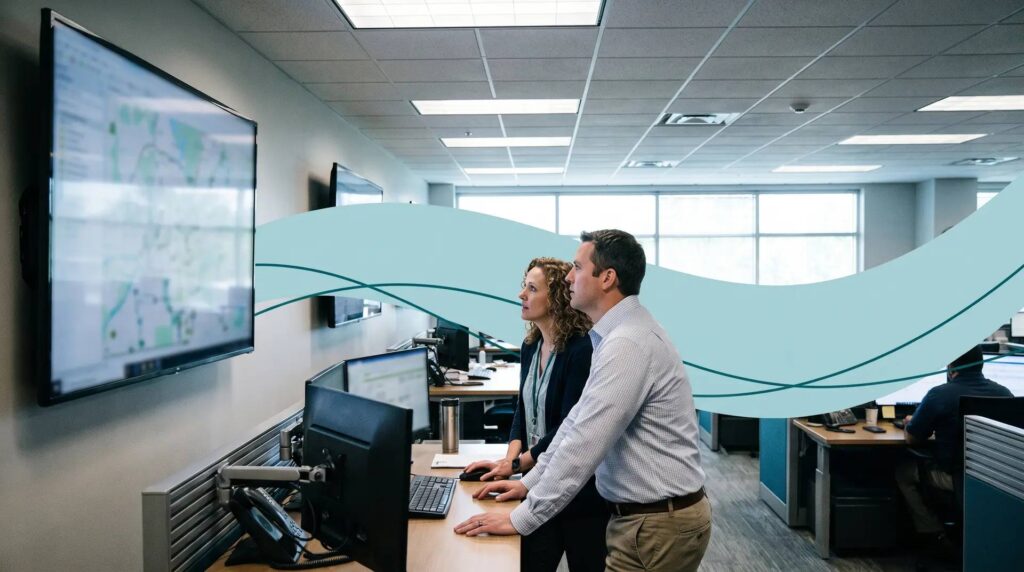
Workforce intelligence for utilities means capturing what your operations workforce actually does, activity by activity, before you commit budget to automation. Not what the work order system says. Not what the org chart implies. What dispatchers, schedulers, billing analysts, and compliance staff actually spend their day doing.
Utilities are unusual among industries in one respect: half of the workforce is measured to death, and the other half is barely measured at all. Field crews generate GPS traces, work-order timestamps, first-time-fix rates, and truck-roll counts. The back office that coordinates all of it, dispatch, scheduling, meter-to-cash, outage management, regulatory reporting, generates almost no activity data anyone can use.
For the wider category, see our guide to workforce intelligence software.
That imbalance is exactly where automation decisions go wrong.
Key Takeaways
- 81% of North American utilities already use AI (Itron, 2025), yet RAND research shows more than 80% of AI projects fail to deliver intended value. Adoption is not the constraint. Measurement is.
- Field service management (FSM) data measures the field layer. It tells you nothing about the coordination layer: dispatch, scheduling, meter-to-cash, and compliance work, which is where most utility automation mandates actually land.
- Activity-level data is fundamentally different from app-level data: “6 hours in the CIS” tells you nothing; “42 minutes resolving estimated-read exceptions from a meter swap GIS never recorded” tells you whether AI can help.
- Five things to measure before you automate: time allocation by activity, exception volume including storm mode, process variation across districts, automation adjacency, and institutional knowledge density.
- A 90-day ground-truth baseline changes the AI roadmap conversation from opinion to evidence, before the budget is committed.
Utilities are not behind on AI. Itron’s 2025 Resourcefulness Report, a survey of 500 electric utility executives across the US and Canada, found that 81% of North American utilities already use AI, with 41% reporting fully integrated deployments and another 40% reporting mature projects underway. Gartner predicts AI in 40% of power and utility control rooms by 2027.
Set that against the general enterprise record: RAND Corporation research found that more than 80% of AI projects fail to deliver their intended business value, roughly double the failure rate of comparable non-AI IT projects. The recurring cause is not model quality or vendor selection. It is that the organization did not know, in measurable terms, what it was automating before it started.
For utilities, that gap has a specific shape. The AI conversation gravitates to the grid: load forecasting, predictive maintenance, vegetation management, outage prediction. Those are legitimate domains with real sensor data behind them. But when board or commission-driven cost pressure turns into a workforce automation mandate, the target is usually not the grid. It is the operations workforce: dispatch, scheduling, billing, collections, compliance. And for that population, the utility typically has no activity-level data at all.
A field service operation runs on two layers. The field layer is visible: crews, trucks, work orders, mobile FSM apps. Every modern utility can tell you jobs completed per crew per day, average travel time, and first-time-fix rate.
The coordination layer is nearly invisible. Dispatchers weighing crew certifications against switching orders and medical-baseline customers. Schedulers rebalancing tomorrow’s work when two crews get pulled onto an emergency gas leak. Billing analysts working the exception queue in the customer information system (CIS). Outage coordinators reconciling what the OMS shows against what the crew radioed in. Compliance staff assembling data requests for the state commission.
These people make hundreds of judgment calls a day across CIS, OMS, GIS, workforce management, and asset management systems, plus the spreadsheets bridging the gaps between them. Their work determines whether the field layer runs efficiently. And in most utilities, nobody can say with evidence what they actually do all day.
That is precisely the population most exposed when an automation mandate arrives. See how the Capture, Classify, Insight methodology surfaces this invisible layer.
Workforce intelligence is not field service analytics, and it is not employee monitoring. Both distinctions matter.
FSM analytics measures outcomes of field work: jobs per day, travel time, first-time fix. Useful, but it measures the truck, not the workforce around it. It cannot tell you why dispatch takes four hours each morning to lock the day’s schedule, or which part of that is automatable.
Monitoring measures presence: logged in, active, idle. It produces productivity scores and tells you almost nothing about automation readiness.
Workforce intelligence measures the work itself. Not that a billing analyst spent six hours in the CIS, but that 42 minutes went to estimated-read corrections, 38 minutes to move-in/move-out exceptions, 55 minutes to payment-arrangement calls the IVR should have handled, and 47 minutes to a weekly commission report that two other analysts also build separately because nobody ever standardized it.
Only that level of detail supports an automation decision. App-level data captures the container. Activity-level data captures the work.
In a pure back-office operation, app-level data is merely shallow. In a utility it is actively misleading, because so much of the coordination work exists to bridge systems that do not talk to each other and field conditions that no system records.
The dispatcher is not “in the WFM tool.” She is on the radio, checking a feeder map she knows is outdated, and overriding an auto-schedule because the system does not know that one crew’s foreman is the only person certified for that substation. None of that appears in any application log. It only appears when you measure at the activity level, which is what the Ground Truth AI² Platform™ was built to do: click-region capture, no keystrokes, classified by vision AI into actual activities.
This is the data an operations leader needs before any utility AI investment conversation. Not which vendor to pilot. What to measure first.
“Dispatcher” is not a unit of measurement. “31% of dispatcher time goes to manually rebalancing schedules the WFM system got wrong” is a unit of measurement.
Utility coordination roles blend transaction processing, exception handling, radio-and-phone coordination, and reporting in proportions that vary by district and season. Until you know the actual breakdown, you cannot identify automation candidates, and you cannot size the benefit case with anything but vendor benchmarks from operations that do not look like yours.
Utilities have a measurement trap most industries do not: the operation has two states. Blue-sky days, when work is planned and exceptions are moderate, and storm response, when the same back-office staff pivot to damage-assessment intake, mutual-aid coordination, restoration-time communication, and regulator notifications.
A baseline captured only in blue-sky conditions sizes automation to blue-sky volume. Then the first major event hits, the automated workflow floods with exceptions it was never trained on, and the people who used to absorb that surge have been reassigned or reduced. Measure long enough to see both states, and treat storm-mode workload as a first-class input to the automation decision, not an outlier to be cleaned from the data.
High-exception workflows are high-knowledge workflows. Automate them without a baseline and you find out what you lost when the SLAs and the commission complaints start moving.
Two schedulers in two districts, using the same systems, may be solving different problems: different feeder architectures, different franchise agreements, different local codes, different inherited workarounds. When a process is performed differently across your territory, that variation is information. Either a best practice is waiting to be standardized, or the variation is legitimate and any automation must accommodate it.
You cannot know which without measuring all of them. Skip this step and you build the automation around one district’s version of the process, then discover in rollout that the other districts were handling real edge cases, like municipal-boundary billing rules, that the automated version ignores.
Within a single role, some activities are structured and rule-based, exactly what AI handles well. Meter-to-cash is the classic example: routine move-ins, standard billing runs, and payment posting automate cleanly. But the exception layer, high-bill complaints, estimated-read disputes, medical-baseline holds on disconnections, carries judgment, regulatory exposure, and customer risk.
Automation adjacency scoring maps this at the activity level: automatable now, automatable after a training period, or redesign first. That is what turns a vague mandate (“automate the back office”) into a phased roadmap with defensible numbers. If you are deciding where to start, our guide on how to know what to automate in operations covers the scoring logic in depth.
Every utility has workflows that function because one person knows something that is written down nowhere. The dispatcher who knows which GIS feeder maps are wrong. The billing analyst who knows which meter routes throw bad reads after firmware updates. The scheduler who knows which contractor crew will actually show up for storm duty.
In utilities this risk has a deadline. The Bureau of Labor Statistics projects about 72,700 openings for electricians each year, on average, from 2025 to 2035. Training replacements takes years, not months, and the coordination roles around the field workforce face the same demographic curve with even less documentation.
Automate without measuring institutional knowledge density and you discover what the retiring workforce knew only after it is gone, with no data for the AI to learn it from. Measured before automation, that same knowledge becomes the thing you capture and transfer first.
Facing an automation or headcount mandate for your utility operations? Book a 30-minute strategy call with Wendy Kinney. No pitch. A clear conversation about where your data gaps are and what a 90-day baseline would take.
Here is how this plays out without a baseline.
A director of customer operations at a mid-sized investor-owned utility gets a mandate: reduce back-office cost 12% through automation, with meter-to-cash as the target because a consultant benchmark says peers run it leaner. Her team maps the process in workshops, builds the business case, and automates billing exceptions and move-in/move-out processing. The pilot works. Routine transactions automate cleanly.
Two quarters later the savings are a third of the target. The gap is the exception layer: estimated-read disputes tied to a meter-exchange backlog, payment arrangements governed by state disconnection rules, and high-bill complaints that spike with every rate change. The two senior analysts who handled those exceptions through a mix of CIS access and twenty years of tariff knowledge were redeployed early, and one took a package. Escalations now route to the contact center, handle times climb, and the commission starts asking about complaint volumes.
The technology did not fail. The decision was made without activity-level data on what those two analysts actually did.
The same dynamic applies when the pressure arrives as a headcount number instead of a technology project. A board cites a peer benchmark. A COO is asked to defend staffing the benchmark says is 15% heavy.
With ground-truth data, the response is specific: exception volumes by category, storm-mode workload the benchmark cohort does not carry, activity-level evidence of what the “extra” headcount actually does, and a phased plan for which roles can shrink once specific workflows are stabilized. Without it, the response is instinct against a spreadsheet, and instinct loses that meeting. The playbook is in how to respond to an AI headcount mandate .
The Ground Truth AI² Report™ is a data document, not an opinion document. Over a 90-day engagement, the platform captures activity-level data across your operations workforce, coordination layer and back office alike, and the operational overlay interprets what it means for your specific mandate. It is the version of an AI readiness assessment for operations that actually reaches the activity level: time allocation, exception profiles, process variation, automation adjacency scores, and knowledge-density mapping, for every role in scope.
From that foundation, the roadmap conversation changes. Instead of “which workflows should we automate,” it becomes “here is what the work actually is; here is what is automatable now, later, and never; where do you want to start?”
What data does a utility need before automating back-office or field service operations?
Activity-level data on the operations workforce: how time is actually allocated by task, where exceptions concentrate (including storm-mode surges), how much process variation exists across districts, and which workflows depend on undocumented institutional knowledge. Most utilities have extensive FSM and grid data but none of this workforce activity layer.
Is field service management (FSM) data enough to plan automation?
No. FSM data measures field outcomes: jobs completed, travel time, first-time fix. It does not measure the coordination layer (dispatch, scheduling, meter-to-cash, compliance) where most workforce automation mandates land, and it cannot separate rule-based work from judgment calls within a role.
How is workforce intelligence different from employee monitoring in a utility?
Monitoring tells you whether someone is present and active, and produces productivity scores. Workforce intelligence classifies what work is being done at the activity level, and produces automation adjacency scores. For an AI roadmap, only the second is useful. The capture is also less invasive than tools most utilities already run: click-region only, no keystrokes.
How long does it take to build a workforce activity baseline for a utility?
A ground-truth baseline across an operations area of 50 or more employees takes 90 days with the Summit Trails platform, with initial findings at weeks three to four. Traditional consulting approaches approximate the same picture through interviews and sampling over 12 to 18 months, and still miss the activity level.
Can this data help push back on a headcount mandate instead of executing it?
Yes. That is one of its most common uses. Activity-level data shows what your staffing actually covers: exception volumes, storm-mode capacity, and knowledge concentration that peer benchmarks do not reflect. The outcome of a baseline is a defensible position, whether that means answering the mandate or challenging it.
The utility AI conversation is dominated by the grid and the field: sensors, FSM platforms, predictive maintenance. Those matter. But the automation mandates now reaching operations leaders mostly target the coordination workforce, the least-measured layer in the building.
Before you automate, measure what that workforce actually does. Time allocation by activity. Exception volume across blue-sky and storm conditions. Process variation across districts. Automation adjacency. Institutional knowledge density, on an aging-workforce clock.
Utilities do not have an AI adoption problem; 81% are already in. They have a measurement problem, and the ones who close it before committing budget are the ones whose roadmaps survive contact with reality.
Book a 30-minute strategy call with Wendy Kinney. In 30 minutes you will know where your data gaps are, what a 90-day ground-truth baseline of your operation would require, and whether Summit Trails fits your situation. No pitch. No obligation. Just a conversation grounded in 20-plus years of operations experience.

Ready to Help Your Team Reach the Peak? See us in Action.